OVA Dashboard
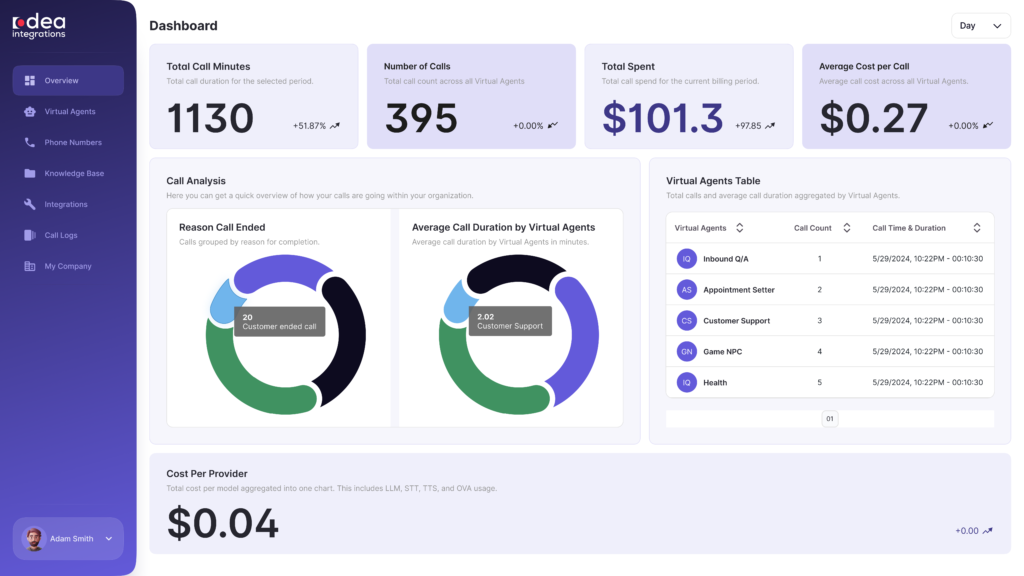
After login, you will see the OVA Dashboard which is designed in a way to provide all the important information in a single view. The OVA Dashboard offers a comprehensive view of your virtual agent operations by breaking down essential metrics into several sections: Call Analysis, Cost Analysis, Agent Table, and Cost per Provider. Here’s an overview of each section, its importance, and its functions:

Call Analysis
Importance: Understanding how calls are being handled by each virtual agent provides insight into the performance and efficiency of your virtual agents, highlighting patterns and areas for improvement.
- Function: This section uses pie charts to visually represent key metrics:
Reasons Call Ended: Shows the breakdown of how and why calls concluded (e.g., successfully resolved, transferred to a human agent, or customer ended the call). This helps pinpoint common call outcomes and areas where improvement may be needed.
Average Call Duration by Agent: Displays the average length of calls handled by each virtual agent, allowing for performance comparison. A shorter duration generally indicates efficiency, while longer calls may suggest complex issues or areas requiring optimization,

Cost Analysis
Importance: Cost monitoring is crucial for maintaining budget control and identifying trends in expenses associated with virtual agent interactions.
- Function: This section provides detailed cost-related data according to the selected period:
Total Call Minutes: Total duration of all calls in your selected period, which can be a benchmark to assess overall usage.
Number of Calls: Total count of calls handled, giving insight into agent workload and system demand.
Total Cost: Summarizes the total expenses during specific period, useful for budget tracking.
Average Cost per Call: Calculates the average expense per call, helping to assess cost efficiency over time.

Agent Table
Importance: The Agent Table gives granular insights into each agent’s workload and call handling efficiency, enabling better workforce and performance management.
- Function: Provides a tabular view of individual agents’ activities:
Call Count of Each Agent: Tracks the number of calls managed by each agent, useful for workload distribution and productivity assessment.
Call Duration with Time and Date: Shows the length of each call along with when it occurred, which is valuable for detailed analysis and identifying peak usage periods or trends in call durations by time of day.

Cost per Provider
Importance: This section offers a high-level view of costs per provider, which is vital for evaluating the cost-effectiveness of different virtual agent models or service providers.
Function: Aggregates the total cost per model or provider into a single chart, enabling you to compare expenditures across different providers. This comparison can assist in decision-making around selecting or negotiating with providers based on cost efficiency.

Each section of the OVA Dashboard thus contributes to a holistic understanding of both operational and financial aspects, helping you optimize virtual agent performance and manage costs effectively.
